Designing an infectious disease biotech brand
Dr. James Wilson took the math behind weather forecasting and pointed it at infectious disease. We built the brand, marketing site and product UI kit — then watched the platform become Nevada's COVID response dashboard.
 Live since 2020
A weather forecast for disease.
Dr. James Wilson had spent his career building something the public health world didn’t quite know what to do with. He took the math behind weather forecasting and pointed it at infectious disease. Strep throat. Foot-and-mouth. Ebola. He could tell you, with surprising accuracy, how many cases of a stable disease would land on a given day in a given region. The CDC used his work. So did the Department of Defense, the WHO and NASA.
When he moved his forecasting center to the University of Nevada, Reno, he wanted to commercialize the science under a new banner: M2 Medical Intelligence. Same forecasting engine, productized for hospital systems, public health departments and biosecurity teams that needed earlier signal.
He came to us to build the brand, the website and the UI kit for the web app. None of us knew that within a year, the product would be running on a governor’s desk.
Make a forecasting tool feel as serious as the science behind it.
The category had a positioning problem. Most disease surveillance products either looked like government dashboards from 2003 or leaned so hard into Silicon Valley aesthetics that they undermined the credibility of the underlying work. Dr. Wilson’s audience was hospital administrators, state epidemiologists and federal agencies. Those buyers don’t want a startup vibe. They want to feel like they’re looking at the same kind of tool a meteorologist trusts.
Three goals shaped the engagement: build an identity that read as scientific authority without feeling cold or clinical; ship a marketing site that could explain forecasting to a non-technical decision maker in under two minutes; and deliver a UI kit the engineering team could use to build out the dashboard product without designing every screen from scratch.
Identity, site, UI kit.
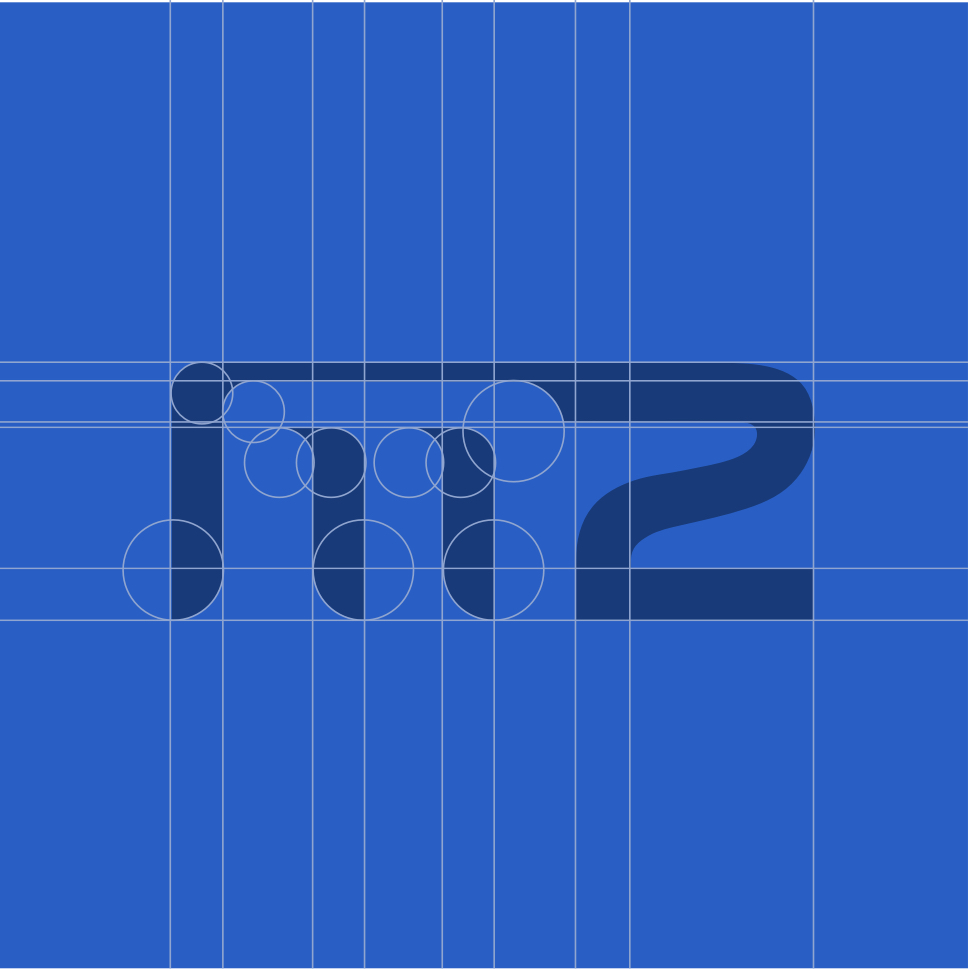
Brand identity
A visual system anchored in the metaphor Wilson kept returning to: forecasting. Isobars, contour mapping, time-series readouts — borrowed from meteorology, grounded in the precision of medical reference materials. A deep clinical blue with a single warning accent reserved for risk states inside the product. Built to flex from a federal procurement deck to a hospital system's portal without retooling.
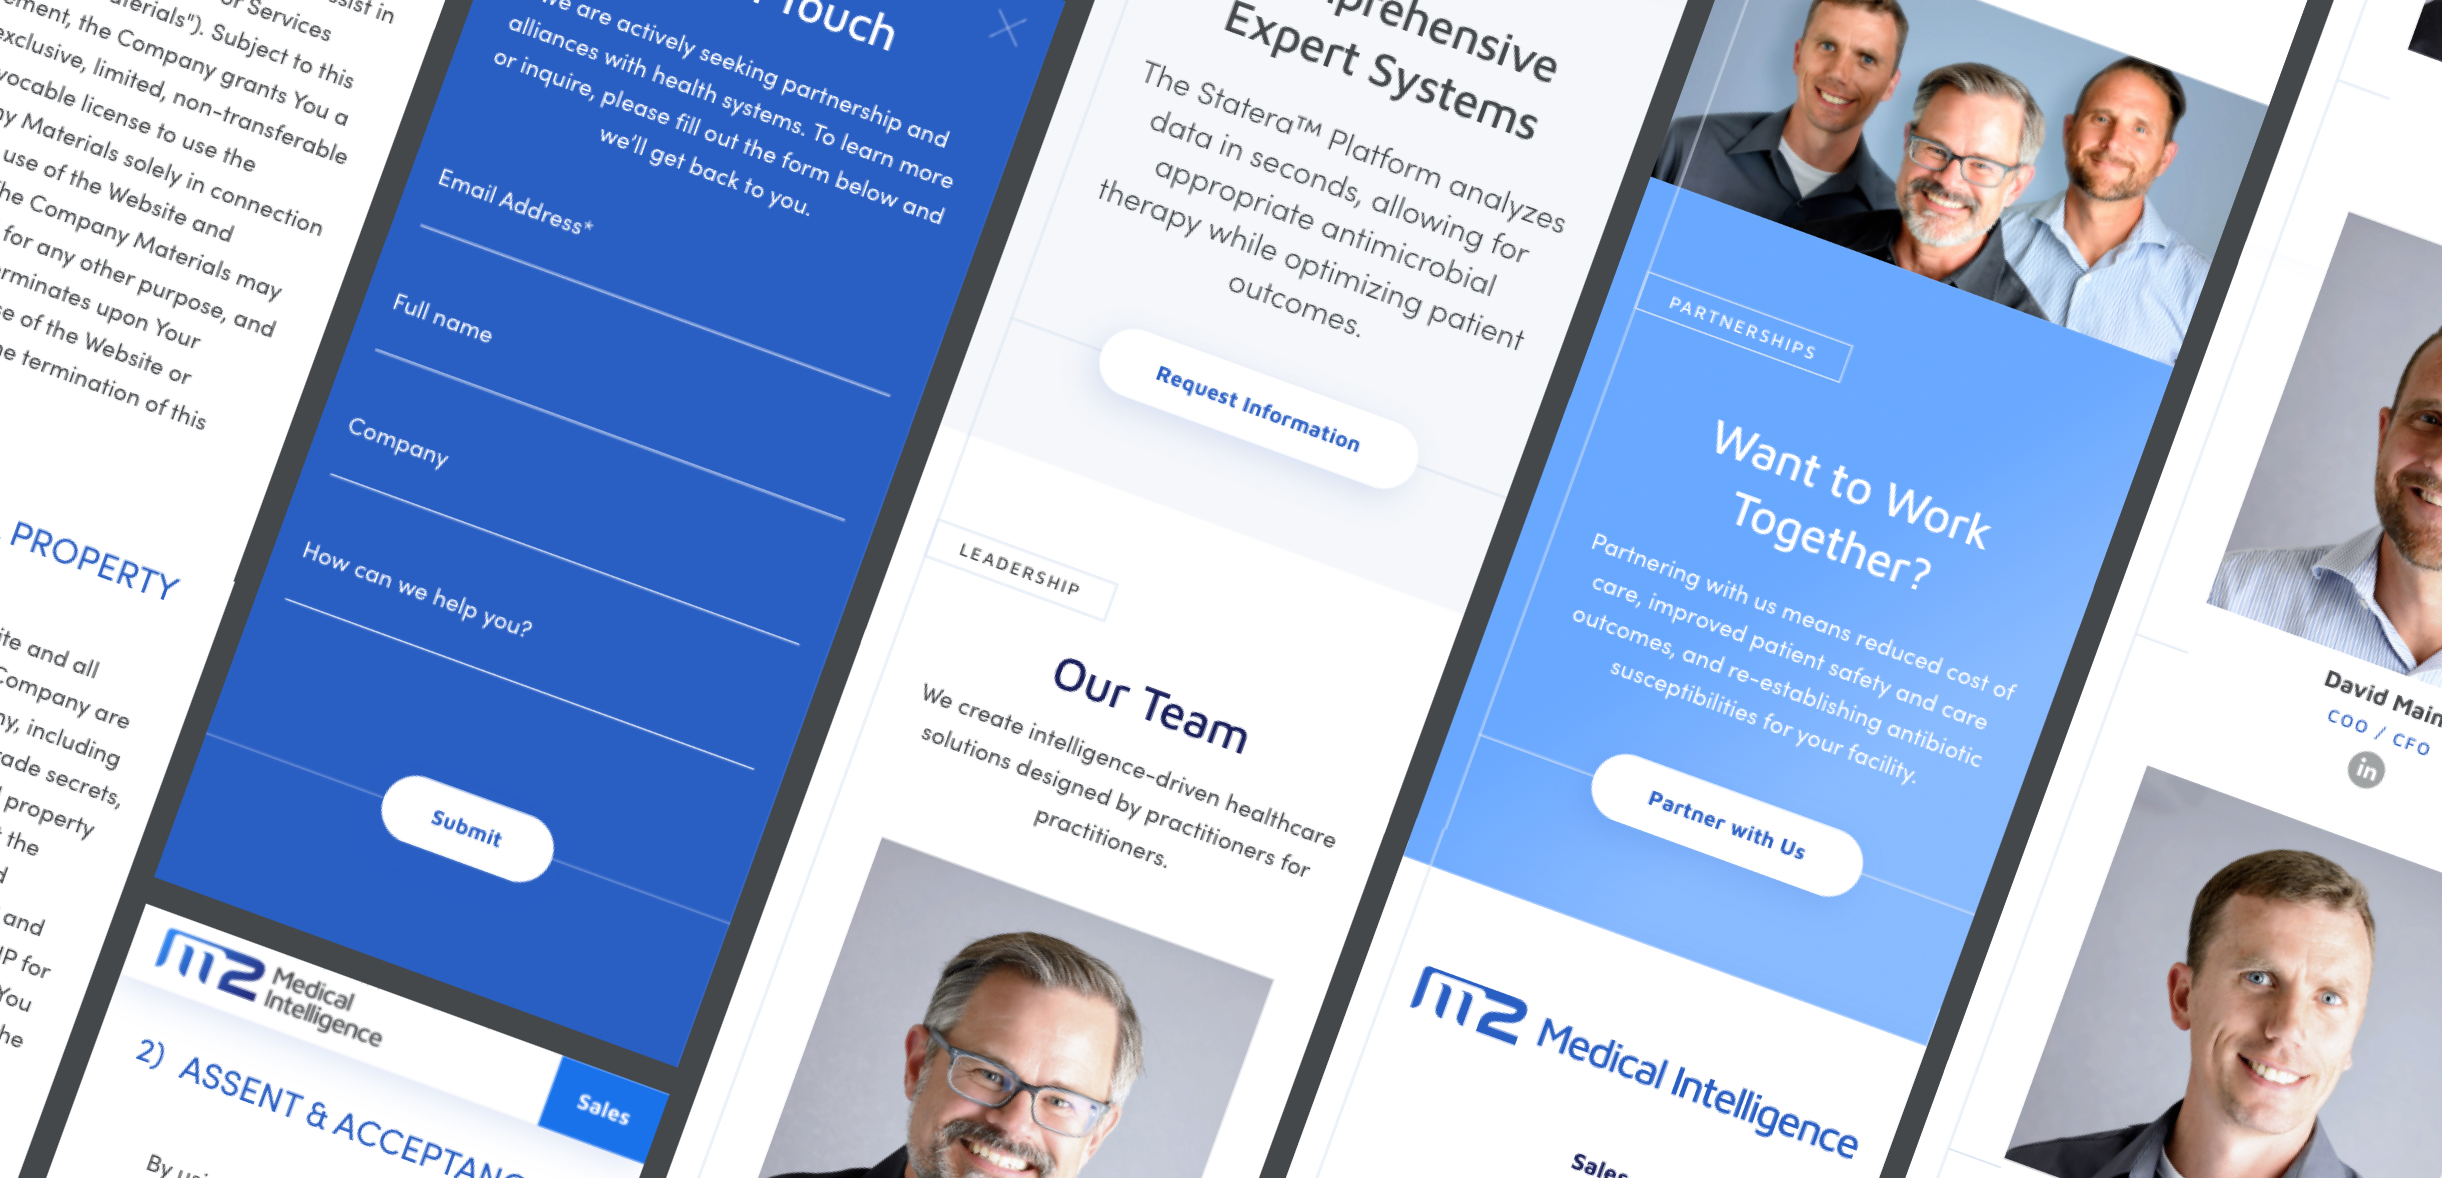
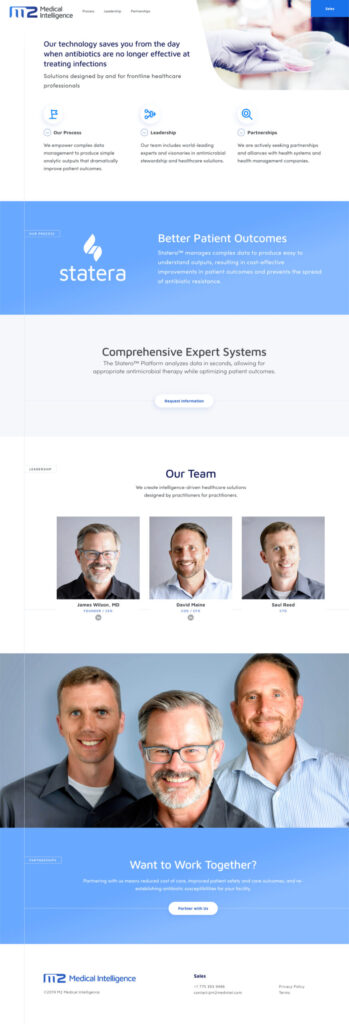
Marketing website
One job: get a public health director to understand, in the time it takes to drink a coffee, that this was a serious tool built by a serious operator. Led with Wilson's track record (CDC, DoD, Ebola response, NASA), explained the forecasting engine in plain language, and gave a visible path to a demo. No abstract data swirl, no scientist-with-hologram hero — just clear typography and real diagrams pulled from the methodology.
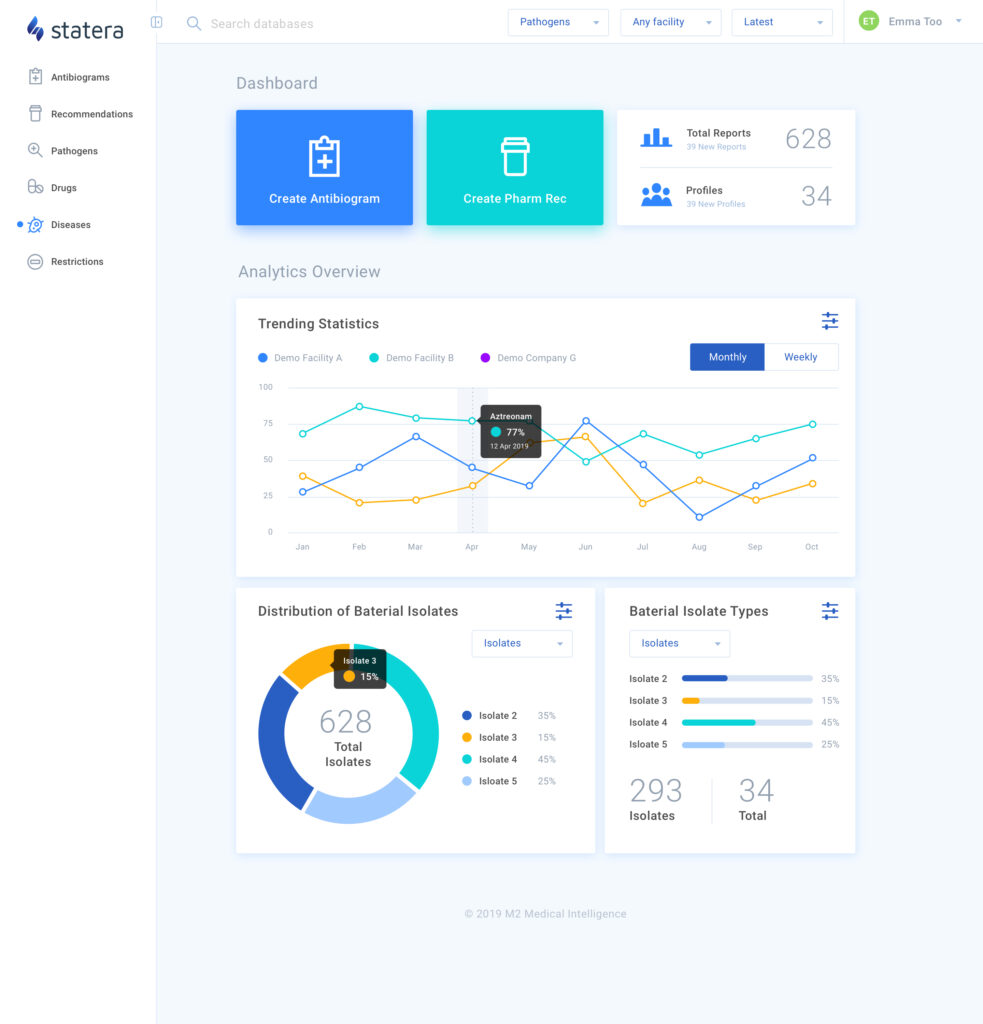
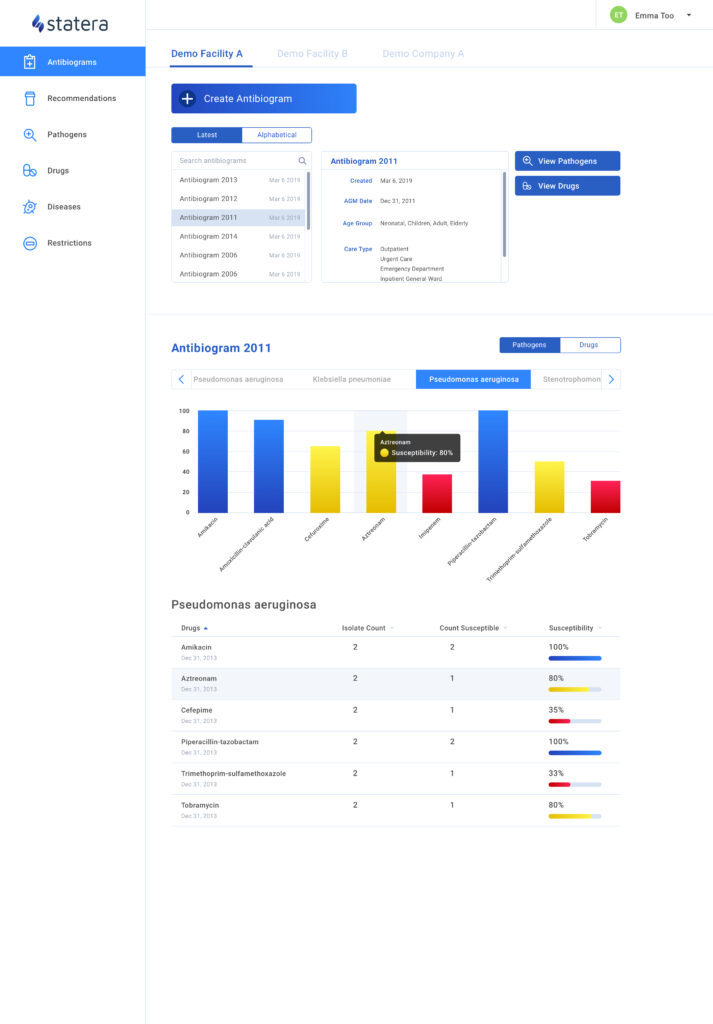
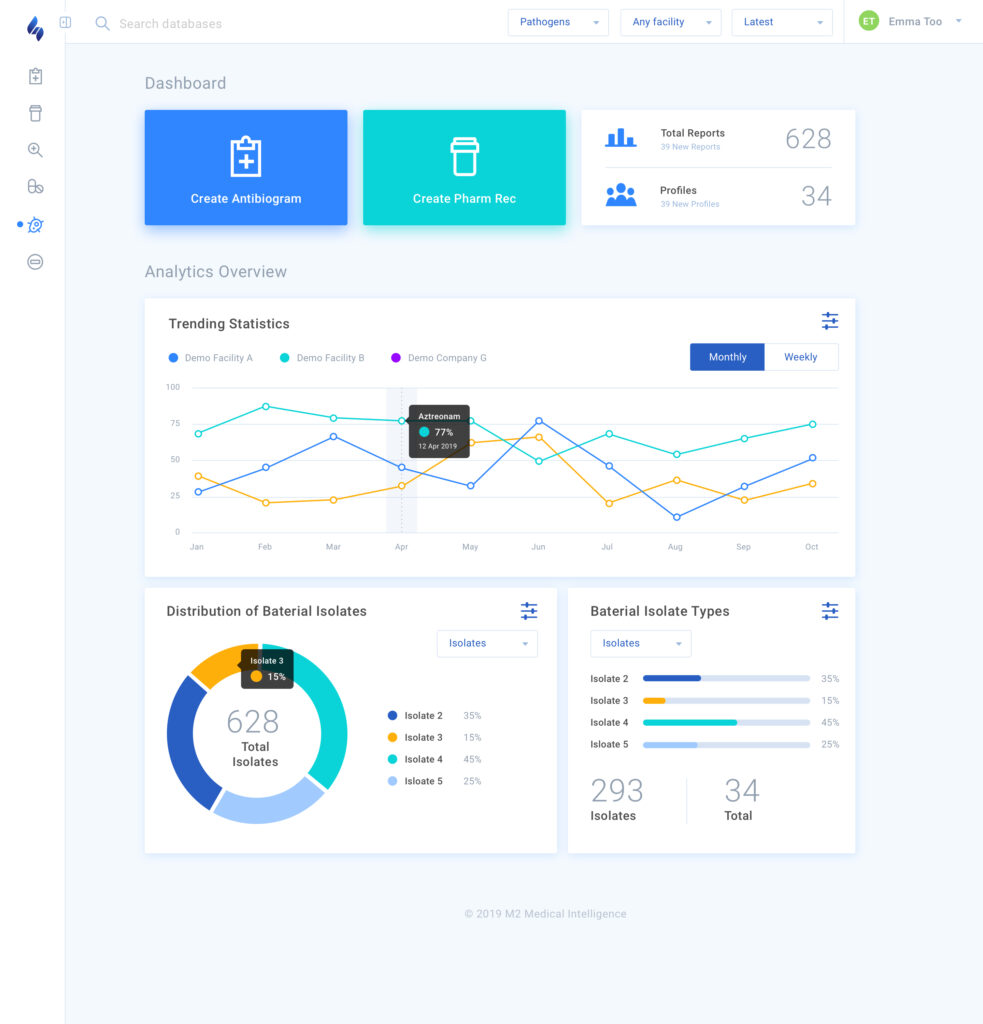
Web app UI kit
A component library covering the patterns the engineering team needed most: forecast charts, threshold alerts, regional map overlays, hospital-capacity indicators, and table treatments for case data. Every component documented with default, hover, alerted and degraded-data states so dev could move without coming back to design for every edge case. That decision turned out to matter more than we knew.
Then COVID hit.
The product was approaching its commercial launch when SARS-CoV-2 arrived. Almost overnight, M2 stopped being a product looking for hospital system contracts and became a tool the State of Nevada needed running by Monday.
Wilson’s forecasting model was repurposed into a live operating dashboard for the Governor’s office. It tracked COVID outbreaks by county, modeled projected hospital admissions, surfaced ventilator and ICU capacity in real time, and informed decisions on lockdown timing, regional restrictions and vaccine distribution as those programs came online.
The UI kit we’d built for a future commercial product was suddenly the foundation of a state-level public health response. The forecast chart components were now showing the curve. The capacity indicators were tracking real respirators in real hospitals. The alert states were live. Because the system was already designed for high-stakes, time-sensitive readability, the engineering team could ship the dashboard fast without redesigning the visual language. The brand we’d built for credibility in a procurement meeting held up in a press conference.
From product launch to policy tool.
State pandemic response platform
M2's dashboard became the working surface for Nevada's executive-level COVID decision making — outbreak tracking, hospital capacity monitoring and vaccine rollout sequencing.
Identity that held across audiences
The system worked for federal, state and clinical buyers without a refresh, supporting briefings, public communications and ongoing platform development.
Build velocity at the critical moment
A documented UI kit let engineering focus on data integration and modeling instead of redesigning interface patterns under deadline pressure.
Day-one analytical capacity
Wilson's research and forecasting work continued to inform public health policy in Nevada — giving the state an analytical capacity most states didn't have on day one of the pandemic.
Build the system to outlast the brief.
The original engagement wasn’t scoped for a global pandemic. No engagement is. The reason the work translated so cleanly when the use case shifted is that we built every piece of the system to the standard of the science it was representing, not the standard of the market we thought we were entering.
A brand built to look credible in a procurement deck is going to look credible in a press briefing. A UI kit built for hospital administrators making capacity decisions is going to work for a governor making lockdown decisions. The audience changed. The job didn’t.
Most of our work doesn’t end up on a state government’s emergency response stack. But every brand we build is built so that if the client’s circumstances change, the system bends instead of breaking. That principle started long before COVID. M2 just happened to be the case study that proved it.
Selected work from the engagement.


We took a page from the science of weather forecasting to do the same for diseases — from foot-and-mouth to strep throat. Using the same processes, we can forecast a variety of medical conditions.
Like what you see? Let's talk about your commerce stack.
A 14-day strategic diagnostic — we audit your current stack, identify the friction worth fixing first, and ship a phased plan with sized investments. Fully credited toward an engagement if we move forward together.
What you walk away with
- ✓A measured map of every friction point in your current commerce flow
- ✓Three phased options — minimum, considered, comprehensive
- ✓Sized investments and timelines, no aspirational ranges
- ✓A clear "don't hire us if…" section. We mean it.
